
Do you want to adopt SRE in your organization or have you just started with the SRE implementation? Irrespective of what stage of SRE maturity curve your organization is in, you need to have a clear understanding of how to build a successful SRE team, how to measure your organization’s progress, and how to analyze the outcomes.
In this blog, we outline the significance and various stages of the SRE maturity model and how to evaluate and interpret an SRE maturity report.
Why is it important to evaluate your SRE Maturity progress?
Though most tech giants have set standard SRE best practices, SRE as a discipline need not be one-size-fits-all. You can customize your SRE practices (add or ignore a few best practices) to suit your specific business requirements. While adopting SRE to meet your unique needs is crucial, it is equally critical to evaluate your SRE maturity progress at least every 6 months as it helps you:
- Figure out the direction you need to take in the future
- Build the next course of action
- Structure your SRE roadmap better
- Understand the status of your SRE team and organization requirements
- Identify improvement areas in your organizational performance and capabilities
Stages of the SRE Maturity Model
Visibility
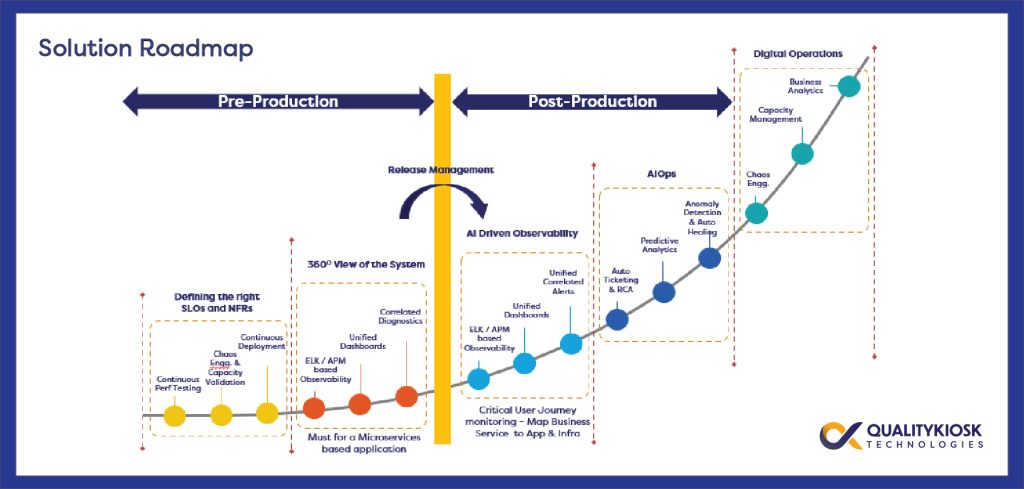
Stage 1: Prepare – Define SLOs, SLIs, and Error Budgets
The first level of the SRE maturity model is to define and configure customer-centric Service Level Objectives (SLOs) and error budgets — representing the accepted tolerance levels by business. SLIs’ based monitoring such as latency, errors and uptime to be applied across infra, storage, network and application layer along with monitoring of critical business flows and end-user performance.
The business service flows originated from several channels and traverse through distributed/ integrated systems comes under the purview of testing and architecture review for reliability, performance, scalability, and resilience gauged through SLIs.
Stage 2: Build – 360-degree View of the System
Once you have set your SLIs and SLOs that will build system reliability, you will ideally work on implementation of context-rich data lakes with unified dashboards, and unified correlated alerts to ensure observability. Especially for microservices-based application, observability is more functional over monitoring because of its complex distributed service architecture.
A hot trend in the market to improve system performance — observability — helps you look at the output to determine your internal system’s health. Observability reports primarily help you identify gaps and perform incident management seamlessly leading to improved detection and recovery times thus minimizing customer impact.
Observability ensures consolidation and correlation of multi-dimensional data (events, traces, and metrics) through layers that map business KPI with IT KPIs. By evaluating the observability reports, and providing deeper insight into the system’s performance, you can determine the health of the system, do faster root cause analysis, and identify the bottlenecks. Next, automated change and release management is implemented for traceability and release bug-free code at speed. The context-rich data obtained through Observability helps in measuring and managing Error Budgets which can be used as an effective tool to prioritized feature releases against changes required to address stability matters.
Analytics
Stage 3: Perform – AI Driven Observability
With an AI-driven data analysis approach to Observability, you can automate and accelerate incident response. AI helps in alert noise reduction and minimizes false positives. Precise actionable alerts coupled with end-to-end visibility into the system and an up-to-date knowledge database, facilitate auto post-mortem and remediation. This significantly improves the ability to detect, investigate (MTTD/I) and resolve (MTTR) the incident quicker. Through blameless post-mortem, problem management can benefit tremendously in driving improved stability and Mean Time Between Failure (MTBF).
Stage 4: AIOps Implementation
AIOps is applying AI and machine learning in IT Operations. AI/ML driven advance analytics gain visibility into complex data patterns and discover areas that need action. AIOps helps you get ahead of issues by leveraging predictive analytics and anomaly detection. With accurate diagnosis of the issue and automated workflow thereon could provide auto healing capabilities leading to autonomous IT operations. This significantly improves service availability and reliability while reducing toil and fatigue on SRE/operations teams leading to a joyful employee experience.
Reliability
Stage 5: Experience Digital Operations
With the existing market landscape demanding an increasing number of changes at faster frequencies, you have to significantly reduce operational toil. These tactical, predictable, and inefficient tasks can be automated by integrating a digital approach.
Our digital operations accelerate application release and eliminate toil. This level of the SRE maturity model in an organization helps SRE engineers and DevOps practitioners to automate capacity management, chaos engineering, and leverage business analytics for actionable insights.
How to Evaluate and Interpret your Maturity Report? While the SRE Maturity Model gives you steps to progress in your SRE implementation, you need to evaluate this progress at regular intervals to ensure you are on the right track. QK SRE maturity framework will help customers to understand the gaps in their SRE adoption and drive it faster through a data driven assessment. Below is a quick checklist you can use to examine your momentum.
| # | Activity | Rating | ||||||
|---|---|---|---|---|---|---|---|---|
| 1 | 2 | 3 | 4 | 5 | ||||
| 1 | Business and IT is aligned on Service Level Objectives (SLOs) | |||||||
| 2 | Service Level Indicators (SLIs) provides measurable insight on SLO compliance | |||||||
| 3 | Faster MTTI/MTTD through deeper insight into IT system | |||||||
| 4 | Effective RCA through correlated data view | |||||||
| 5 | Automated release and change management | |||||||
| 6 | Reduction in alert noise and false positives | |||||||
| 7 | Optimal user experience throughout journey | |||||||
| 8 | Accelerated response to incidents | |||||||
| 9 | Failures and service degradation are predicted beforehand | |||||||
| 10 | Self-healing IT systems | |||||||
| 11 | Optimally scaled IT system to meet seasonal and future demands | |||||||
| 12 | Operational efficiency through continuous automation | |||||||
| 13 | Resilient IT systems through chaos engineering | |||||||
| 14 | Informed decision making through business insight | |||||||
| Total Score | ||||||||
The following would serve as a guideline to baseline SRE maturity based on total score derived from the above table:
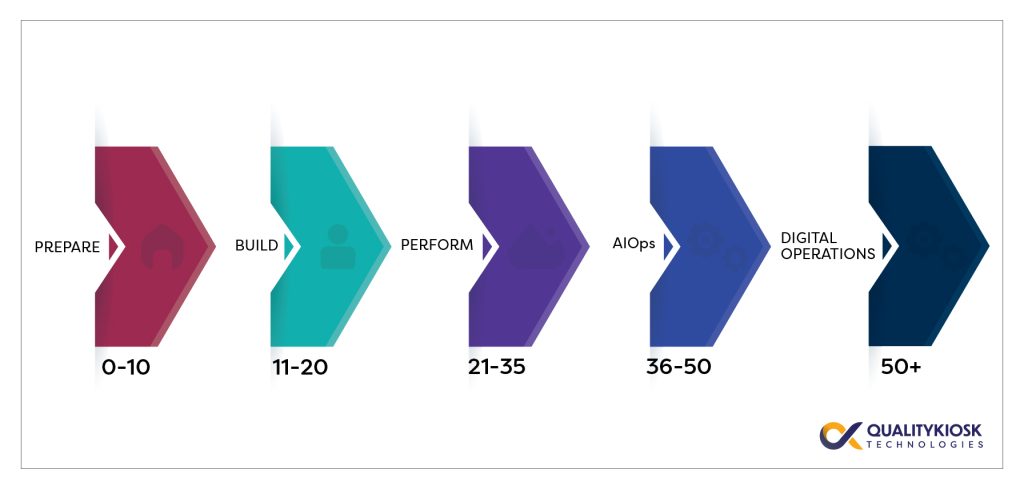
| Guide to Ratings | ||||
| 1 | 2 | 3 | 4 | 5 |
| Ad-hoc/ Informal – The starting point for use of new or undocumented repeat process |
Reactive/Tracked – The process is at least documented sufficiently such that repeating the same steps may be attempted |
Tactical/Defined – Process is defined/confirmed as a standard business process |
Strategic/Controlled – Process is quantitatively managed in accordance with agreed-upon metrics |
Continuous Improvement – Process management includes deliberate process optimization/ improvement |
WHITEPAPER